
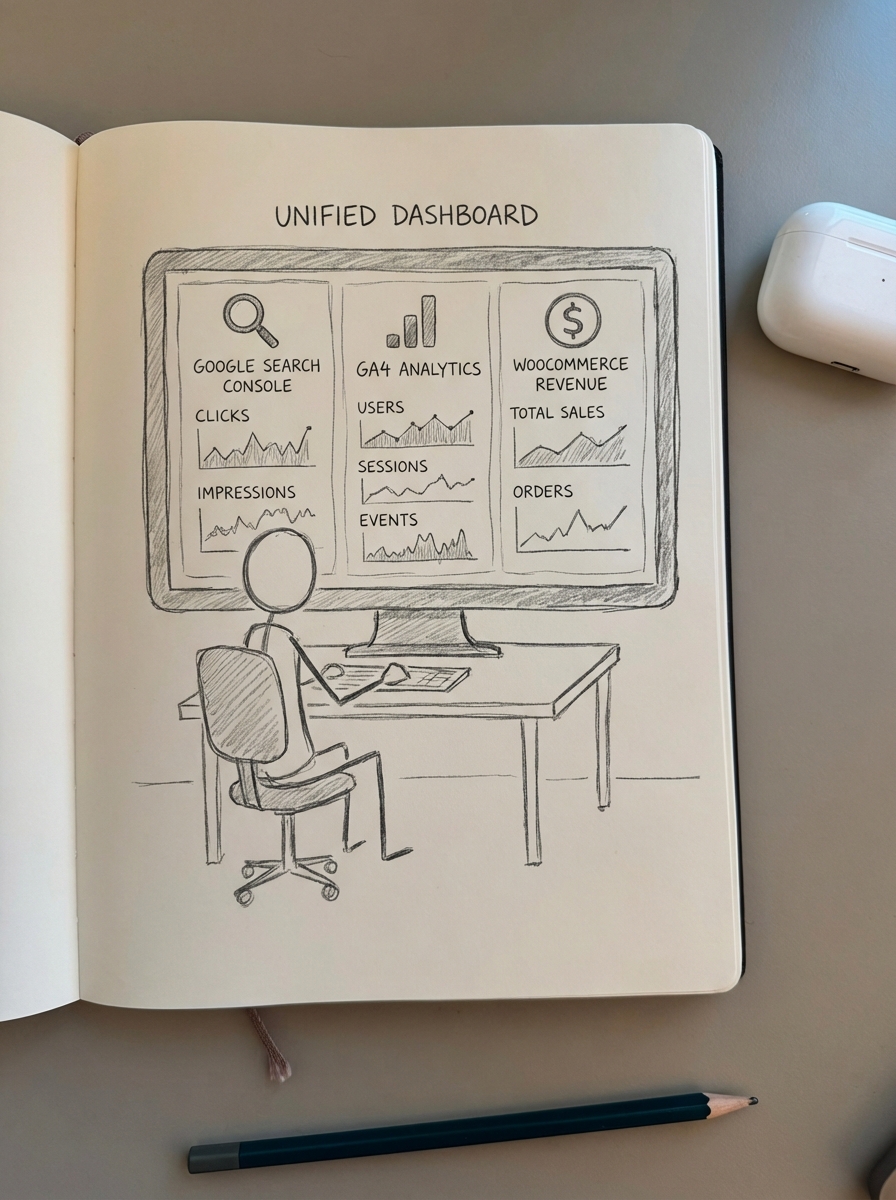
An SEO dashboard is only as good as the decisions it enables. For WooCommerce stores, most dashboards fail because they track vanity metrics like raw traffic instead of connecting search visibility to SKU-level revenue and technical site health. I have built dozens of these systems, and the goal remains constant: stop wondering if your SEO is working and start seeing exactly how much profit each organic session generates. To do that, you must merge Google Search Console visibility, GA4 behavior, and WooCommerce catalog data into a single source of truth.
The essential KPIs for WooCommerce SEO
If you are tracking everything, you are tracking nothing. You should focus on the 20% of metrics that drive 80% of your revenue. I have found that segmenting data by page type – categories, products, and blog posts – is the only way to get an accurate picture of performance. Without this segmentation, you cannot distinguish between top-of-funnel educational traffic and bottom-of-funnel intent.
Revenue per session by SKU
This is perhaps the most valuable and most overlooked metric in ecommerce SEO. It is not enough to know a product page receives 1,000 clicks; you need to know the revenue per session for that specific SKU. In GA4, ensure your item_id parameter matches your WooCommerce SKU exactly to make this attribution work. If a high-traffic page has a low revenue per session, your content likely does not match the search intent, or your pricing has become uncompetitive.
Category-level impressions and CTR
I have long argued that optimizing category pages is more important than product pages for long-term growth. Your dashboard should track impressions and Click-Through Rate (CTR) at the category level separately from your blog or product pages. A sudden drop in category CTR often indicates that a competitor has secured a featured snippet or that your metadata has lost its competitive edge. Category pages represent the highest intent for “browsing” shoppers, so any fluctuation here has an outsized impact on your bottom line.
Technical SEO health and Core Web Vitals
Technical debt kills rankings before your content even has a chance to compete. Your dashboard must monitor the “Big Three” of WooCommerce Core Web Vitals: Largest Contentful Paint (LCP), Interaction to Next Paint (INP), and Cumulative Layout Shift (CLS). We target an LCP of ≤2.5s and an INP of ≤200ms. Since mobile represents over 50% of web traffic, your dashboard should segment these technical scores by device to ensure your mobile experience is not dragging down your desktop rankings.
Schema validation and rich result eligibility
Missing or invalid schema reduces rich result eligibility by 32%. Ensure your dashboard tracks product schema health, specifically looking for review stars and price availability. These rich snippets can increase CTR by 25-40% when implemented correctly. Beyond just traditional search, getting your schema right is the first step in optimizing for AI search engines like Perplexity or ChatGPT, which rely on structured data to parse your catalog.
Dashboard layouts and templates
I recommend using two distinct views: a high-frequency health check for operational monitoring and a monthly strategic deep-dive for growth planning.
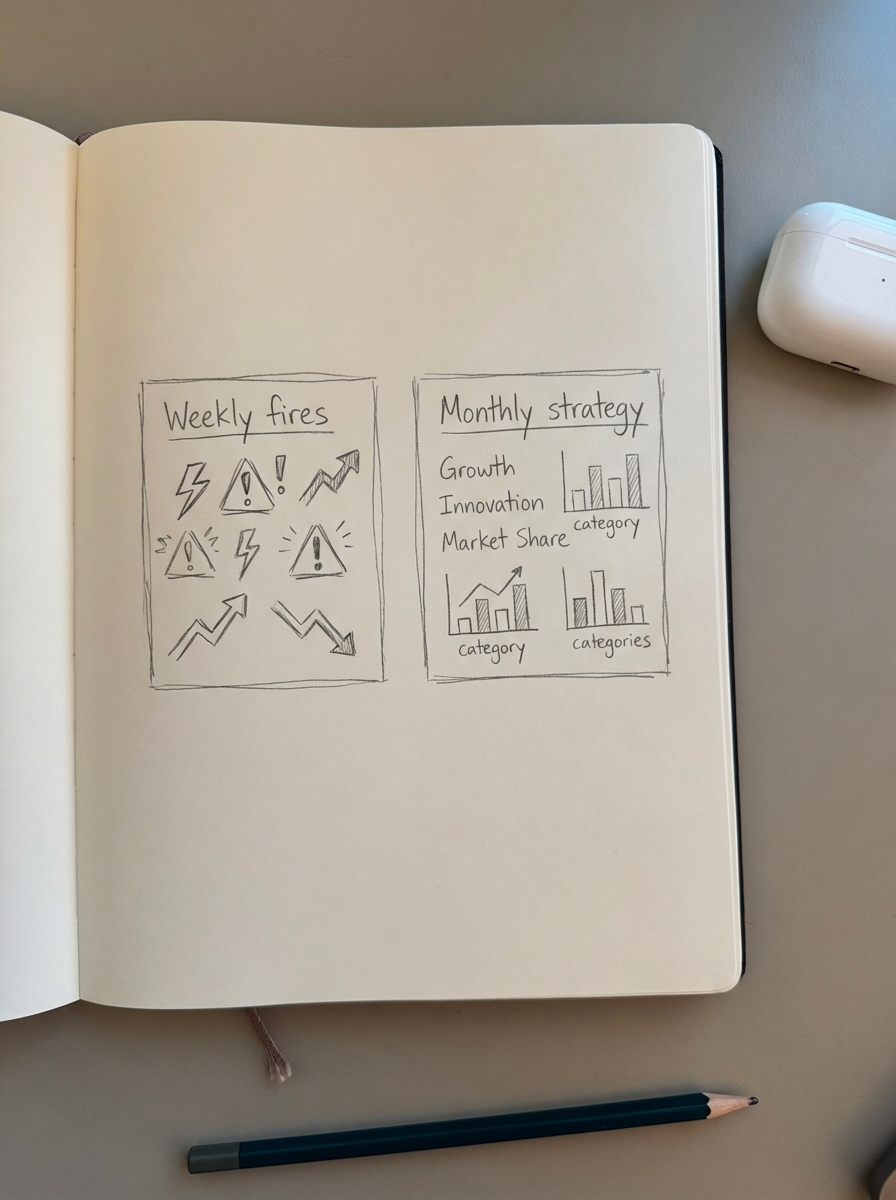
The weekly health check
This is a five-minute review designed to spot fires before they burn your profit margins. Your main focus here should be organic sessions by category with a week-over-week comparison to identify sudden drops. You should also set up automated alerts for urgent issues like ranking drops of more than five positions, sudden traffic loss exceeding 20%, or new 404 errors found during a site crawl. Monitoring crawl efficiency – the total pages crawled per day versus your total product pages – helps ensure Google is not wasting its budget on duplicate pages.
The monthly deep-dive
This is the strategy view where you hunt for breakout opportunities. Create a keyword opportunity table for queries ranking in positions 4–10 that have high impressions but low CTR; these are your low-hanging fruit for title tag optimization. You should also include a SKU performance breakdown showing organic impressions, clicks, and revenue per SKU. This data helps you decide where to invest in new blog content or which category pages need more robust internal linking to support high-performing products.
Comparing SEO dashboard tools
Choosing a tool depends on your technical appetite and how much manual work you want to handle every Monday morning.
- Looker Studio (Formerly Google Data Studio): This is the industry standard for custom reports because it integrates natively with GA4 and Search Console. It is free and highly customizable, but it can be slow with large datasets. It also requires significant manual effort to combine GA4 and Search Console data effectively.
- Databox: This is an excellent choice for marketers who want a mobile-first experience and robust alerting. It offers various SEO report templates that look great out of the box. However, it can become expensive as you add more data sources and generally lacks the deep “catalog awareness” required for enterprise WooCommerce stores.
- ContentGecko Reporting: We built the ContentGecko ecommerce SEO dashboard specifically for WooCommerce stores that want to automate the connection between content and cash. It connects directly to your store via our WordPress Connector plugin to sync your product catalog. This allows the dashboard to automatically segment traffic by page type and attribute revenue to specific blog posts and products without manual tagging.
Common dashboard mistakes to avoid
One of the most frequent errors I see is tracking vanity metrics like raw traffic without connecting it to revenue. Ranking first for a high-volume keyword feels like a win, but if it has a 90% bounce rate and zero conversions, it is a distraction. You must focus on SEO ROI benchmarks; WooCommerce stores typically see an SEO ROI of 2.6x at 12 months, but only when properly attributed.
Another mistake is obsessing over meta descriptions. In my view, nobody should be writing meta descriptions manually in 2026 because Google rewrites them more often than not. Do not waste space on your dashboard tracking meta description completion. Instead, use that space to track topical authority or the health of your internal linking.
Finally, do not treat all traffic as equal. If your blog traffic is growing while your product page traffic remains flat, your content strategy is failing to push users down the funnel. Use page type segmentation to isolate these trends and ensure your educational content is actually driving shoppers toward your categories and SKUs.
TL;DR
A successful WooCommerce SEO dashboard must link Search Console visibility to GA4 behavior and catalog revenue. Focus on revenue per session by SKU and category-level performance rather than just total clicks to see the true impact of your work. You can use Looker Studio for custom manual views or simplify your life with ContentGecko’s automated reporting to see exactly how your content investments translate into sales.