
SEO isn’t a guessing game; it’s a math problem. If you cannot project the potential return on a content campaign or a technical overhaul, you will never secure the budget you need from stakeholders who think in terms of customer acquisition costs and lifetime value.
To forecast organic growth for a WooCommerce store, I combine first-party historical data with realistic Click-Through Rate (CTR) curves. In my experience, most marketing leads fail here because they rely on third-party keyword volume data. These databases are often too small to accurately represent the long-tail nuances of a 10,000-SKU catalog, and their search volume or competition data can be off by a long way. If your “projections” are based on flawed third-party metrics, they are essentially works of fiction.
The core formula for SEO forecasting
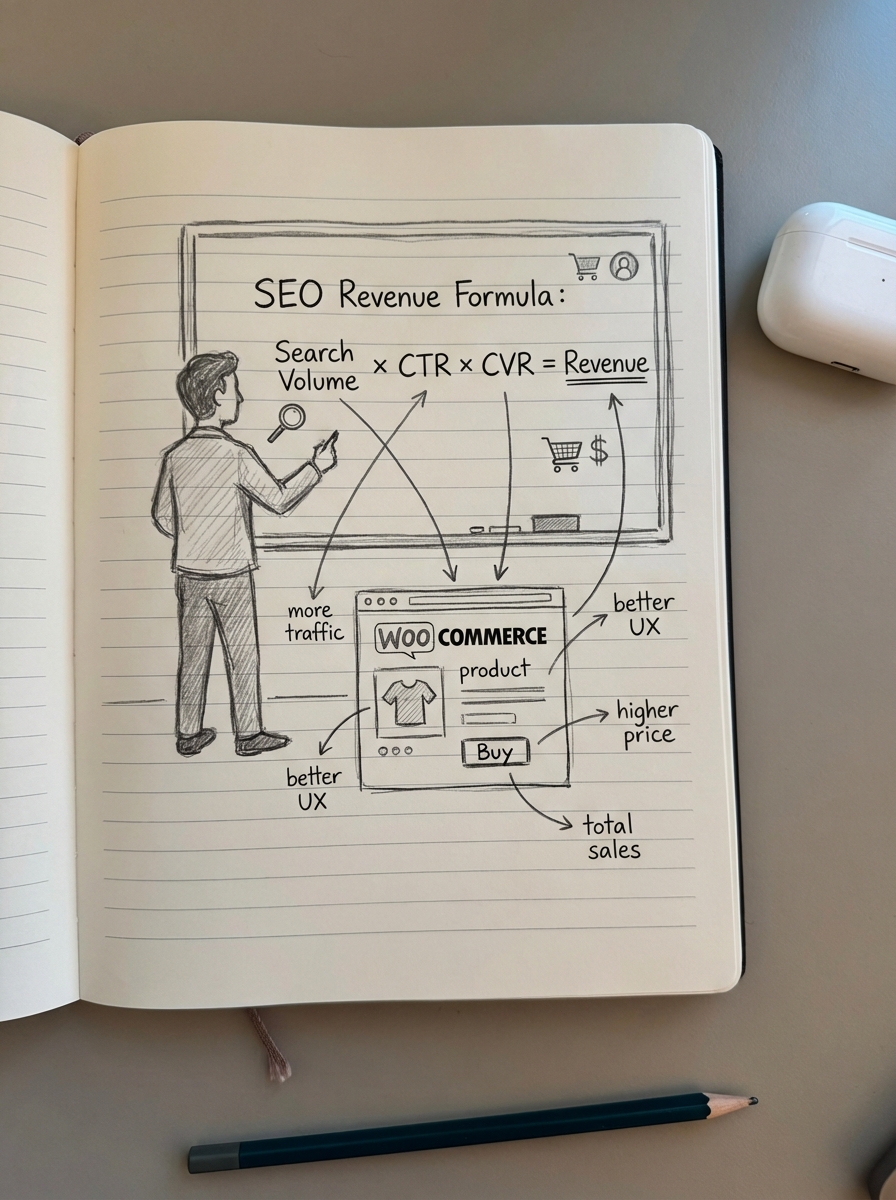
The basic calculation for estimating organic revenue is straightforward: (Monthly Search Volume × CTR) × Conversion Rate (CVR) × Average Order Value (AOV) = Estimated Revenue. While the formula is simple, the variables are where most models break. I treat third-party data as directional at best. For a more accurate “real-world” volume, I use Google Search Console impressions for keywords where the site already ranks in the top 20.
Click-Through Rate represents the percentage of searchers who click your result based on your position. A top ranking might yield 20% to 30%, while a position at the bottom of the first page often drops to roughly 1%. When calculating the conversion rate, I use the site-wide organic conversion rate from GA4 as a baseline but always segment it by page type. Category pages and product pages convert differently than blog posts, and treating them as a monolith leads to inaccurate revenue predictions. Finally, I pull the average order value directly from WooCommerce sales data to ensure the financial side of the model is grounded in reality.
Using GSC data for realistic projections
The most accurate way to forecast is to look at your “striking distance” keywords, which are terms where you rank on pages two or three. I start by exporting Search Console data and how to combine Google Analytics and Search Console data to see which landing pages are already showing signs of life. If a category page is ranking #12 for a term with 5,000 impressions and has a 2% CVR, moving that page to the top three isn’t just a “ranking boost” – it’s a predictable revenue event.
When you automate your SEO reports, you can track “Potential Additional Clicks” at scale. This metric, which we include in our ecommerce SEO dashboard, estimates the traffic you would gain if your current ranking keywords moved to the first position. It provides a necessary ceiling for your SEO opportunity, preventing over-optimistic projections that ignore the reality of your current keyword footprint.
Defining your CTR curves
A generic 10% average CTR is a myth. Your actual click-through rate depends heavily on the SERP layout. If a keyword is buried under four Google Shopping ads, a local pack, and a “People Also Ask” section, your top organic spot might only net a fraction of the clicks you expect. I recommend using specific benchmarks for WooCommerce stores while adjusting them based on your CTR optimization efforts.
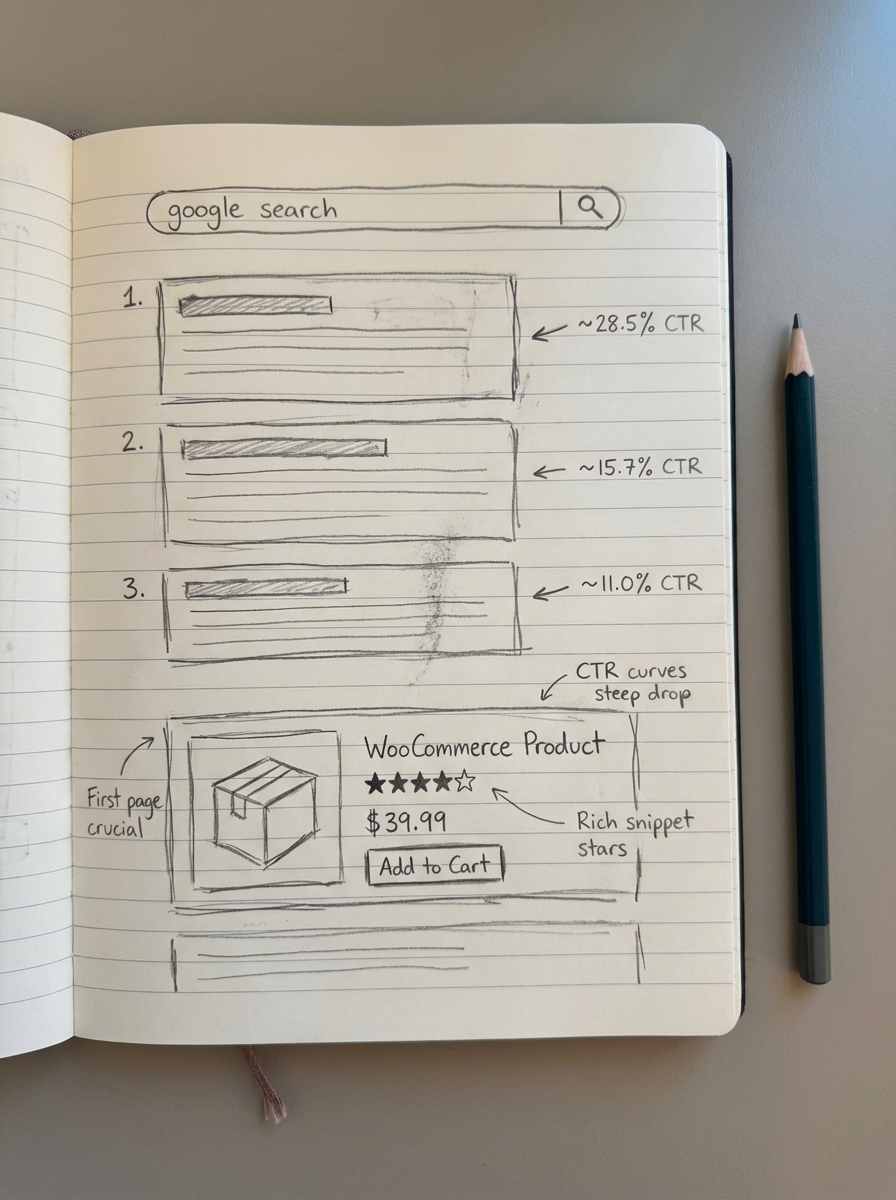
- Position 1: 22% – 30%
- Position 2: 12% – 15%
- Position 3: 8% – 10%
- Positions 4-10: 1% – 5%
If your store uses proper product schema, your rich results can often beat these benchmarks. Seeing star ratings, prices, and stock status directly in the search results provides a trust signal that generic blue links lack.
Calculating ROI and the investment curve
SEO is a compounding asset, not a linear one. In our research on WooCommerce SEO ROI, we’ve found that the average store sees a 2.6x ROI at the 12-month mark, which typically scales to 5.2x after 36 months. This happens because organic traffic persists even after active optimization efforts slow down, whereas paid traffic stops the moment you turn off the budget.
When building your forecast for stakeholders, I suggest presenting three scenarios to manage expectations:
- Conservative: Only “striking distance” keywords move to the bottom of Page 1, reflecting minimal investment or high competition.
- Expected: Targeted keywords move to the top three through a mix of category page optimization and new content production.
- Aggressive: You capture featured snippets and AI Overviews for high-volume informational terms, establishing broad topical authority.
Factoring in the category first rule
Most ecommerce managers over-invest in product page SEO. This is a mistake. Category pages drive the most valuable traffic because they capture “intent-heavy” broad searches. For example, a search for “waterproof hiking boots” is far more valuable than a search for a specific SKU that might be out of stock or have limited sizes.
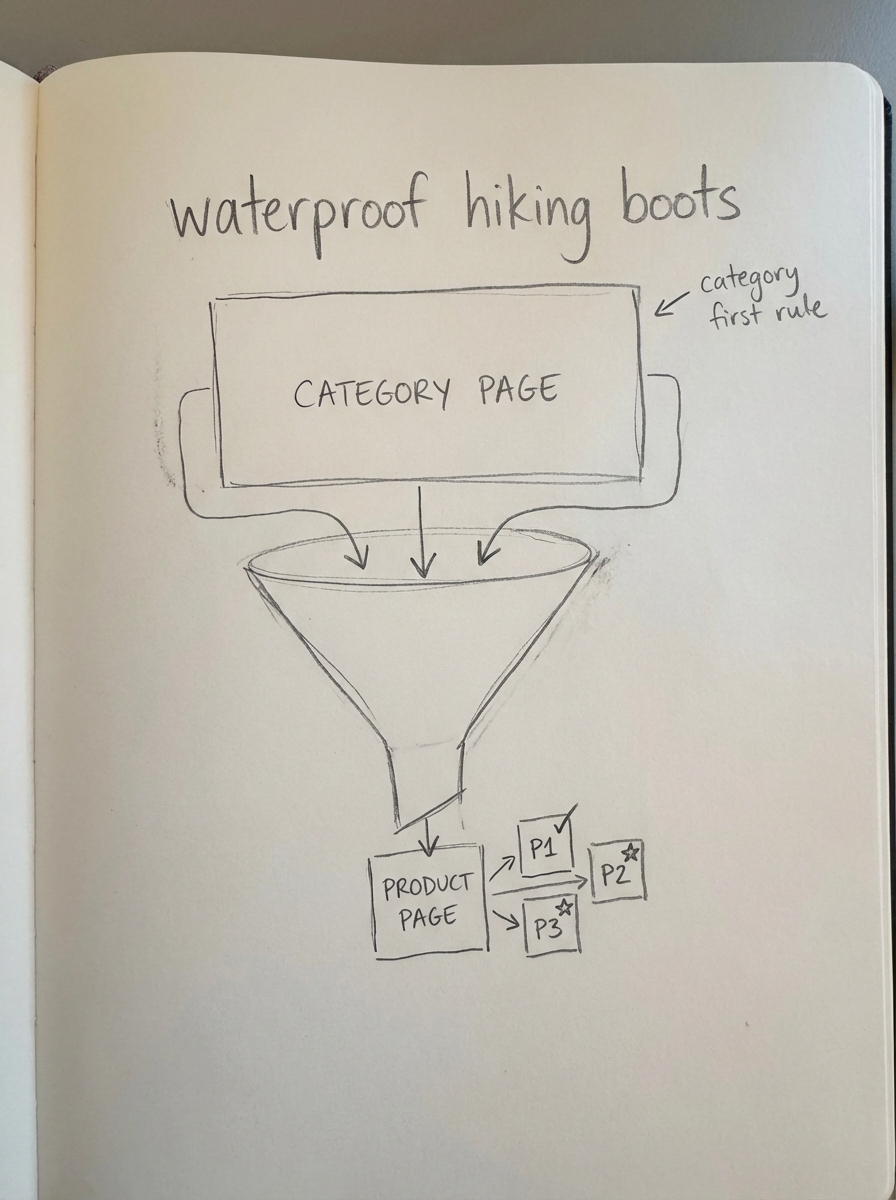
Most websites benefit greatly from more specific category names and better optimization on these hub pages. When forecasting, I weight revenue estimates toward category improvements. A 5% lift in a high-level category ranking often yields ten times the revenue of a similar lift on a single product page because the category page serves as a funnel to multiple products.
Scaling your execution
Once you have a data-backed forecast, the bottleneck is always execution. It is difficult to justify a significant SEO investment if you only have the capacity to write two blog posts a month. We believe that if the basics of ecommerce SEO are done well – which is relatively easy – the remaining opportunity lies entirely in producing a great blog that supports your catalog.
This is where automation becomes a financial necessity. At ContentGecko, we help stores execute this opportunity by using a WordPress Connector to plan and publish catalog-aware content automatically. By syncing with your WooCommerce inventory, we ensure the traffic you forecasted actually lands on pages with products in stock and accurate pricing, turning those estimated clicks into actual revenue.
TL;DR
- Use the formula (Search Volume × CTR) × CVR × AOV = Revenue to ground your strategy in math.
- Prioritize Google Search Console as your primary data source for volume and ignore vague third-party databases.
- Adjust your CTR model for SERP features like Shopping ads and rich snippets to keep projections realistic.
- Forecast by page type, focusing on categories over individual products to capture high-intent traffic.
- Expect a compounding ROI of roughly 2.6x in the first year, scaling significantly as your domain authority builds.
- Monitor your progress in real-time using an automated dashboard to compare actual performance against your forecast.