
Standard SEO reporting for WooCommerce is fundamentally broken when it treats all traffic as equal. For an e-commerce store, a 20% traffic increase to a three-year-old blog post is an irrelevant vanity metric if your top-margin category pages are sliding down to page two. If you aren’t connecting search visibility to your actual product catalog, you aren’t doing SEO; you’re just tracking numbers.
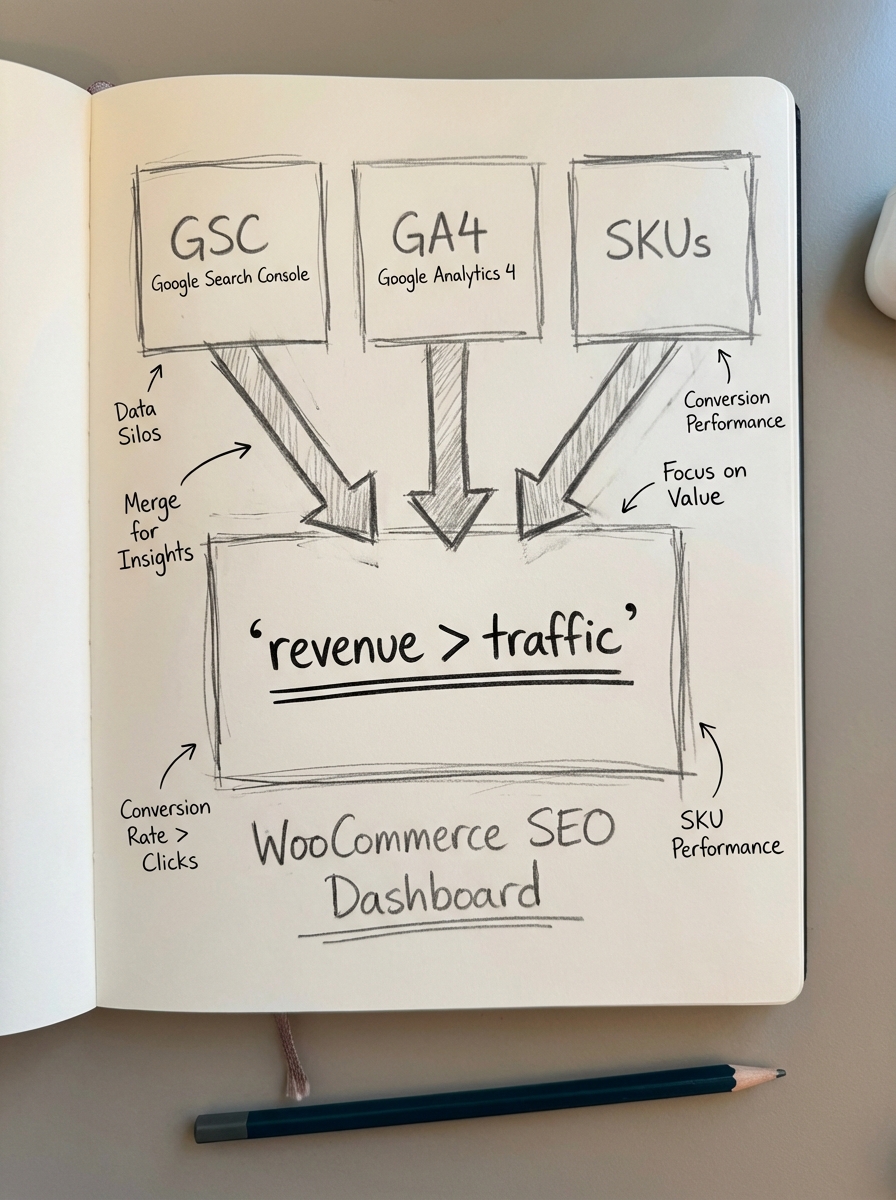
We built ContentGecko’s ecommerce SEO dashboard to solve the “data silos” problem that plagues modern merchants. By consolidating Google Search Console (GSC) visibility, GA4 engagement, and WooCommerce SKU data into a single, catalog-aware view, you can finally stop reporting on vague “visibility” and start reporting on actual ROI.
Why standard analytics fail WooCommerce managers
Most SEO reporting tools fail because they stop at the URL level. They might tell you that a specific product page received 500 clicks last week, but they lack the context of your store’s backend. They don’t tell you that those 500 clicks resulted in zero revenue because the item is out of stock or because your price point is significantly higher than the competition.
I’ve seen too many agencies spend 15+ hours every week manually stitching spreadsheets together. They export visibility data from GSC, conversion data from GA4, and then try to map it to WooCommerce SKUs in a massive Excel file. It is a recipe for human error and results in data that is stale by the time it reaches the client’s inbox.
Effective WooCommerce SEO reporting requires a unified ecosystem where search data and catalog data live together. A ranking jump means nothing if your click-through rate stays flat or your conversion rate on that specific page type is underperforming. We believe that relying on third-party keyword databases is largely useless; the only data that matters is the first-party data sitting in your Search Console and GA4 accounts.
Building a revenue-first dashboard with SKU-level metrics
The most valuable – and most overlooked – metric in ecommerce SEO is revenue per product from organic search. To calculate this accurately, your dashboard must match GA4 organic landing page sessions to specific SKUs. This allows you to identify which products are actually driving the bottom line and which ones are simply burning crawl budget.
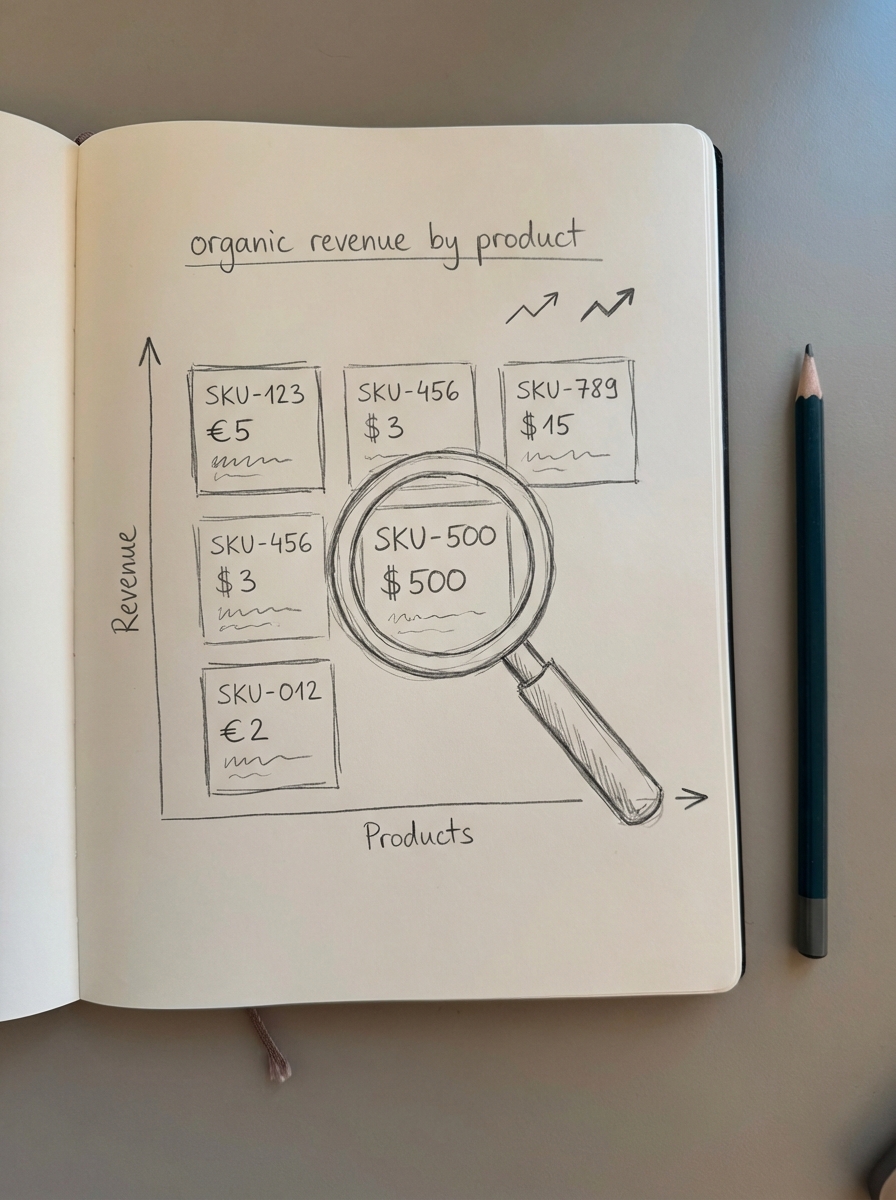
In ContentGecko, we prioritize several SKU-level metrics to provide a clear picture of performance:
- Organic revenue attribution: Directly linking purchases and revenue per session to the specific landing page type.
- SKU performance tracking: Monitoring impressions, clicks, and actual sales for high-value items within the search results.
- Potential Additional Clicks: A rough estimate of the traffic you are leaving on the table by not ranking in the first position for keywords where you already have visibility.
To get this right, you must ensure your GA4 and Search Console setup is flawless. Specifically, the item_id parameter in GA4 must match your WooCommerce SKU exactly. When these data points align, your dashboard shifts from a vanity tracker to a strategic tool that tells you exactly which products to restock, which categories to rename, and which content to optimize.
Segmenting performance by page type
One of our core convictions at ContentGecko is that optimizing category pages is far more important than individual product pages. While product pages capture low-funnel, branded queries, it is your category pages that capture the high-volume “bread and butter” search intent. If your category names are too vague, you are missing the most significant growth opportunity available to a WooCommerce store.
Our dashboards use page type segmentation to automatically filter your data into three distinct buckets:
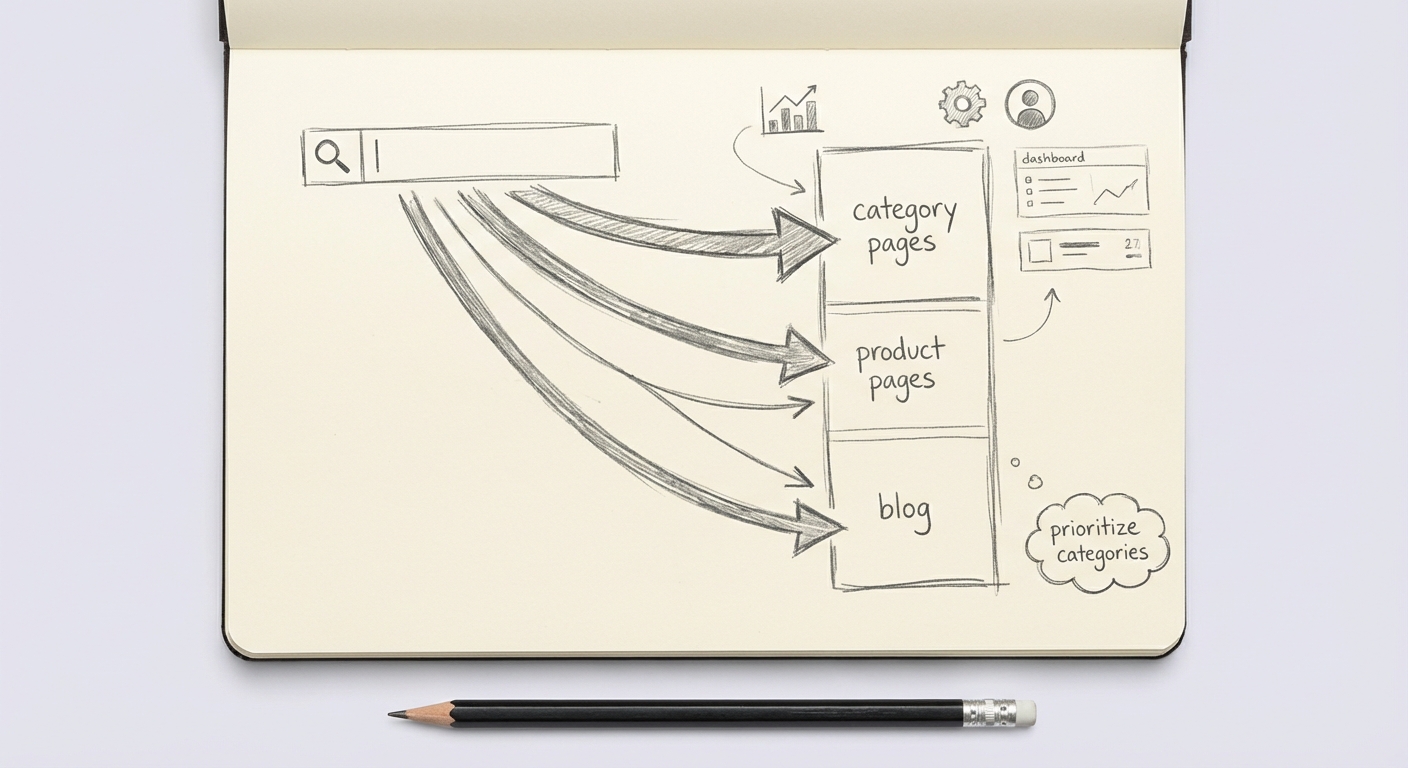
- Category Pages: Track these for broad market visibility. If these are lagging, your site architecture likely needs a refresh or more specific naming conventions.
- Product Pages: Monitor these for indexing issues and rich result eligibility. Research shows that missing or invalid schema reduces rich result eligibility by 32%, which directly kills your click-through rate in a competitive SERP.
- Blog and Informational Content: This is where you capture top-of-funnel intent. Use this segment to identify content decay; updating just five declining articles a month can often boost organic traffic by 45%.
By viewing these segments separately, you can spot when a traffic drop is actually just a seasonal dip in blog interest versus a critical ranking loss on your primary “money” categories.
Customizing reports for agencies and stakeholders
Different stakeholders need different levels of granularity. A data visualization strategy that works for a technical SEO specialist will quickly overwhelm a CMO or a store owner who just wants to know if their investment is paying off.
Agencies use ContentGecko to automate SEO reports, often reducing the time spent on manual reporting from 15 hours to under 2 hours per week. For these users, we focus on white-label reporting with branded dashboards and automated alerts. These alerts flag ranking drops greater than five positions or sudden traffic losses exceeding 20%, allowing for proactive account management. We also help agencies identify “breakout” queries – keywords ranking in positions 8 through 15 that only need a small content refresh to hit the top three spots.
In-house stakeholders and executives, however, rarely care about “crawl budget” or “canonical tags.” They care about revenue growth. For these users, we use our SEO ROI calculator logic to show the financial impact of SEO. Demonstrating that a three-position improvement for top keywords could yield an estimated $180,000 in additional annual revenue is far more persuasive than showing a graph of rising impressions.
Turning dashboard signals into automated optimization
A dashboard is only useful if it leads to immediate action. Most teams look at a report, see a ranking drop, and then spend hours manually diagnosing the issue. We believe in iterating content like a product – launching an MVP and then using data to refine it.
We integrate our dashboards directly with the ContentGecko WordPress connector. This creates a closed loop where dashboard signals trigger actual site changes. When the dashboard identifies a high-impression, low-CTR keyword, or a category page that is losing its “catalog-awareness,” the platform can automate the necessary updates.
For example, if a high-traffic blog post is driving searchers to an out-of-stock SKU, ContentGecko can detect that catalog change in real-time. It then automatically removes the out-of-stock item from the article and replaces it with an in-stock alternative. This keeps your best practices for SEO reporting focused on the ultimate goal: converting searchers into buyers without manual intervention.
TL;DR
Effective WooCommerce SEO dashboards must consolidate GSC, GA4, and SKU data into a single source of truth. By segmenting performance by page type – specifically prioritizing category pages over product pages – and focusing on revenue-per-session rather than just rankings, you can move from manual data-stitching to automated, ROI-focused reporting that drives tangible growth for your store.