
Manual reporting is a significant drain on ecommerce marketing teams, who often spend 10 to 15 hours every week stitching together data from Google Search Console, GA4, and WooCommerce. This “reporting fatigue” frequently leads to the creation of beautiful charts that are never actually used to drive strategy. To scale effectively, you must automate SEO reports so that your energy is redirected toward content production and technical fixes rather than Excel formulas.

Why Looker Studio is the standard for SEO reporting
Looker Studio, formerly known as Google Data Studio, remains the premier SEO reporting tool for WooCommerce store owners. It is free, integrates natively with the Google ecosystem, and allows for sophisticated data blending. While many marketers rely on third-party keyword tools, I have found that their databases are often too small to represent actual store performance accurately. Search volume and competition data in these tools are frequently off by significant margins, making Google Search Console your only reliable “source of truth” for search visibility. Looker Studio allows you to pull this raw data and layer it over GA4 conversion metrics to visualize your entire sales funnel.
Essential KPIs for your ecommerce dashboard
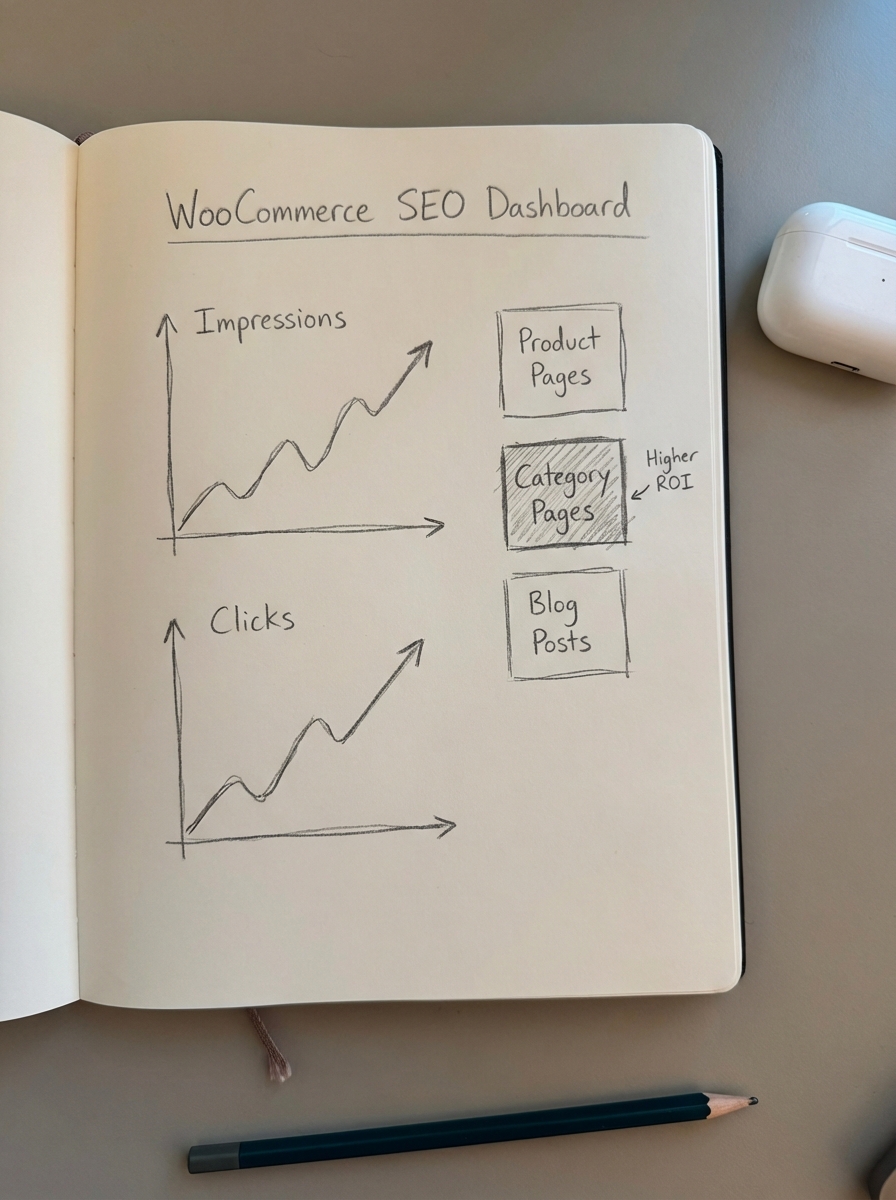
A generic SEO dashboard is insufficient for a WooCommerce environment. You require a setup that understands your specific catalog structure and technical requirements. For instance, research indicates that missing schema reduces rich result eligibility by 32%, yet many dashboards ignore technical health entirely. Your report should prioritize search visibility by tracking impressions, clicks, and average position, keeping in mind that a 5-point ranking improvement is meaningless if your click-through rate remains flat.
Beyond visibility, your dashboard must focus on revenue attribution and page type performance. You should use GA4 data to isolate transactions and revenue generated specifically from organic search. At ContentGecko, we have found that optimizing category pages often yields a far higher ROI than focusing on individual product pages, so your reports should segment data by product pages, category pages, and blog posts. Finally, monitor Core Web Vitals and crawl errors closely. In my experience, a sudden 20% traffic loss is almost always a technical site-wide issue rather than a content problem.
How to set up your SEO report template
To get started, you do not need to build a reporting infrastructure from scratch. You can utilize a Data Studio SEO report template and simply plug in your existing data sources.
The first step involves connecting your data connectors within Looker Studio. You should add Google Search Console, specifically selecting “Site Impression” and “Web” for high-level trends. Next, integrate Google Analytics 4, ensuring your GA4 and Search Console setup is correctly linked at the administrative level before attempting to pull data into the dashboard. For those who want deeper insights, you can also connect WooCommerce data via a third-party connector or a Google Sheets export to bring in SKU-level profit margins.
Once your sources are connected, you must implement page type segmentation using URL filters. For example, any URL containing “/product/” should be categorized as a product page, while “/product-category/” should represent your category pages. This allows you to verify if your current strategy is driving top-of-funnel awareness through your blog or direct sales via product listings. The most powerful results come when you combine Google Analytics and Search Console data by blending the “Landing Page” dimensions from both sources. This helps you identify “low-hanging fruit” – keywords ranking in positions 4 through 10 that have high impressions but require a better CTR or a content refresh to break into the top three.
Automating the insights with ContentGecko
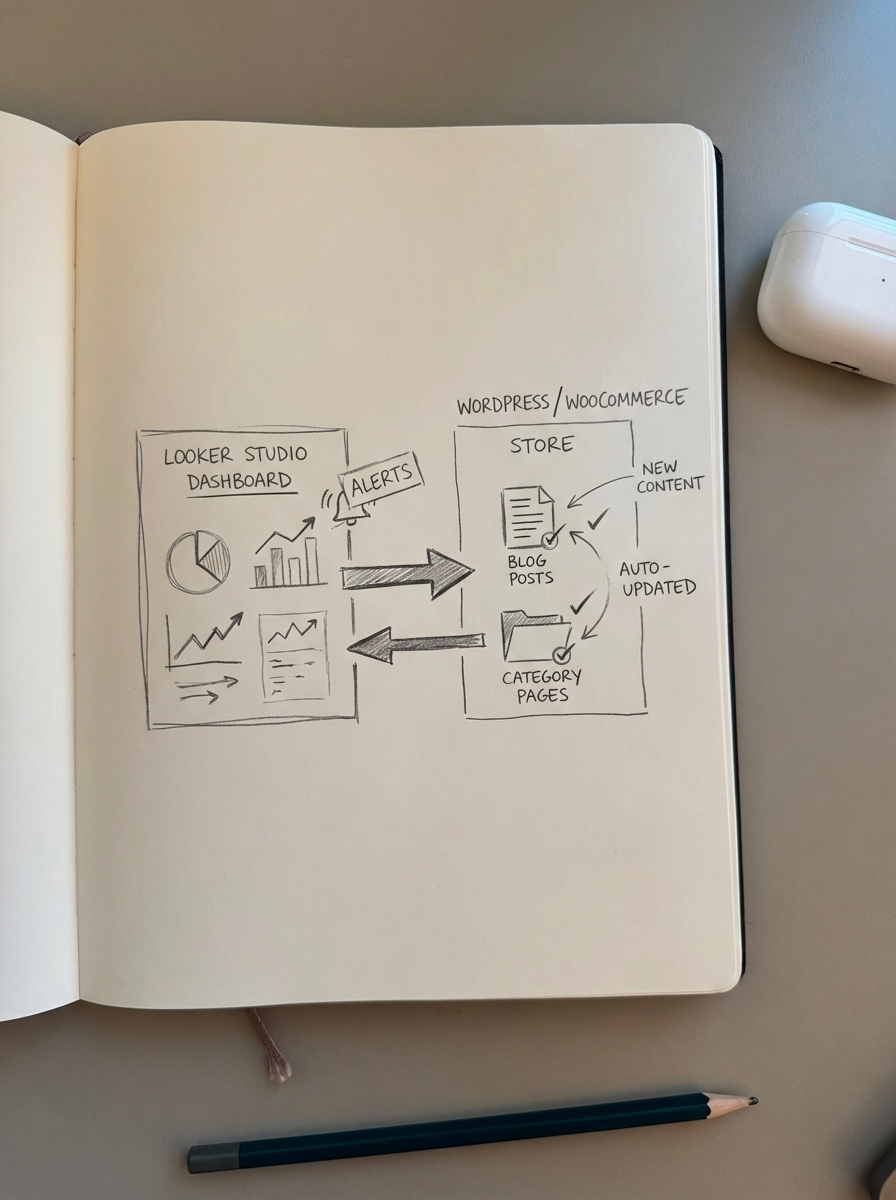
While Looker Studio is excellent for visualization, it does not actually fix the performance issues it reveals. If your dashboard shows that your blog traffic is stagnant, the solution is better content, not more reporting. We developed the ContentGecko ecommerce SEO dashboard to bridge this gap. Our platform goes beyond simple data display; it utilizes a WordPress connector plugin to sync directly with your WooCommerce catalog.
This integration allows the platform to automatically plan, write, and update blog posts that target your most profitable SKUs. If you notice a category is losing visibility, ContentGecko identifies that gap and can publish a buyer’s guide or comparison post to recapture the traffic. It moves the workflow from passive observation to active optimization without requiring manual intervention for every content update.
Best practices for dashboard management
Effective dashboard management requires a disciplined approach to data review and an obsession with metrics that actually move the needle.
- Establish automated email delivery for your dashboards every Monday morning to ensure stakeholders are aligned on the previous week’s performance.
- Prioritize tracking revenue per product from organic search, as this is often the most overlooked metric in ecommerce SEO.
- Avoid wasting time on vanity metrics like “Total Keywords Tracked” from third-party databases, as these are often filled with irrelevant data; focus instead on queries appearing in your actual Search Console.
- Configure an “Urgent Alerts” panel to flag ranking drops greater than five positions or sudden spikes in 404 errors, allowing for immediate technical intervention.
- Monitor SKU availability within your reports, as ranking for an out-of-stock product wastes your crawl budget and creates a poor user experience.
TL;DR
- Stop manual data entry and use Looker Studio to blend GSC and GA4 data for a unified view of your search funnel.
- Segment your reporting by page type to understand whether your ROI is being driven by products, categories, or blog content.
- Focus on revenue-based KPIs and track organic revenue per SKU rather than just raw keyword rankings.
- Close the gap between data and action by using ContentGecko to automatically generate the content your dashboard identifies as missing.