
Most WooCommerce merchants mistake raw traffic growth for success, but without industry-standard benchmarks, even a 10% increase could signal that you are falling behind your competitors. To build a profitable strategy, you must measure your performance against specific ecommerce standards for click-through rates (CTR), conversion rates, and SEO return on investment (ROI).
Why industry benchmarks are your baseline for reality
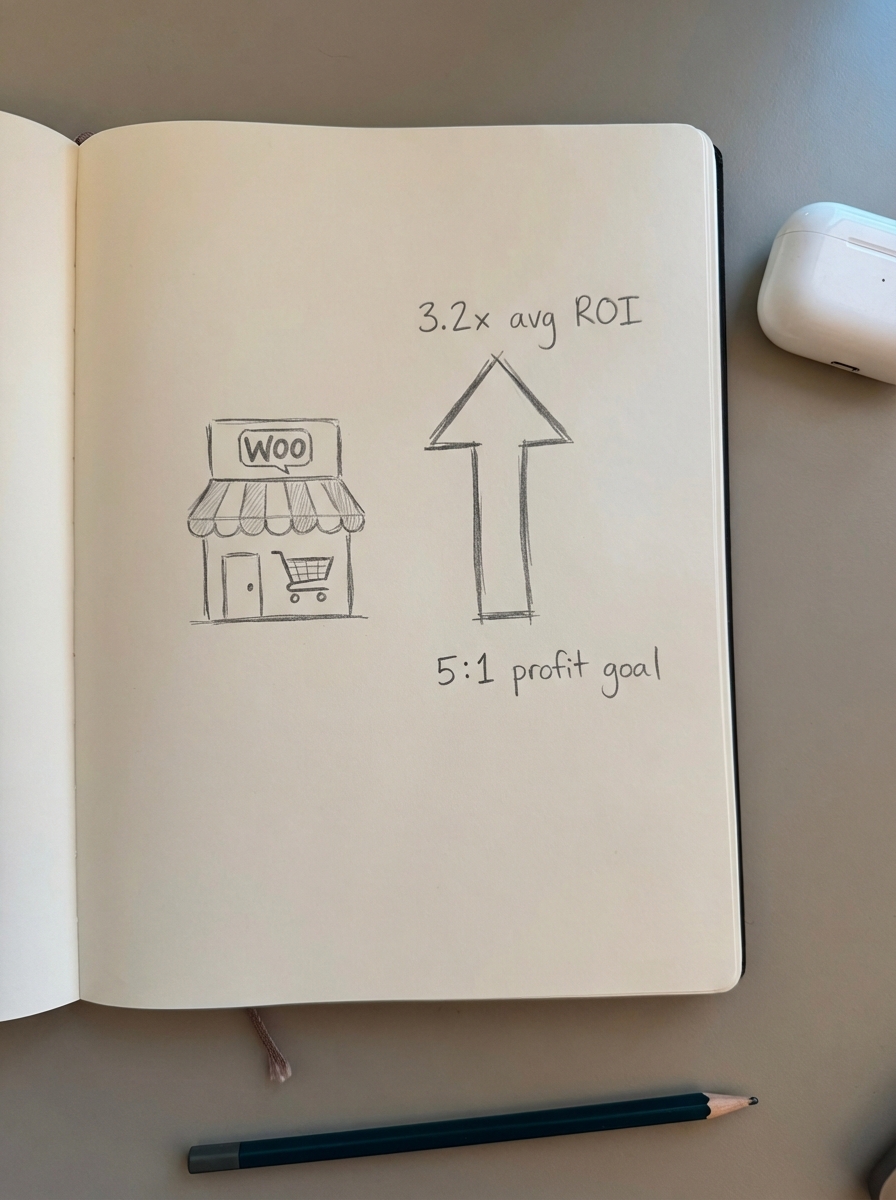
In my experience, many in-house teams set arbitrary goals – like “doubling traffic in six months” – without understanding the baseline for their specific vertical. If you are in specialty retail, you should expect a higher ROI than an apparel brand due to lower competition and higher intent for niche products. According to ecommerce SEO ROI reports, the average 12-month SEO ROI across all ecommerce channels is 3.2x.
This performance varies significantly depending on what you sell. Specialty retail leads the pack with a 4.2x ROI, followed by consumer electronics at 3.4x and home goods at 3.3x. Apparel and fashion generally see a lower return of roughly 2.8x. At ContentGecko, we advocate for measuring WooCommerce SEO ROI not just in raw traffic, but in profit per SKU. A “good” benchmark for ecommerce is a 5:1 return, which translates to $5 profit for every $1 spent on the channel. If you aren’t hitting these numbers, your problem is likely a mix of poor category targeting or a bloated site structure filled with duplicate pages.
Organic click-through rate: The gap between position one and the rest
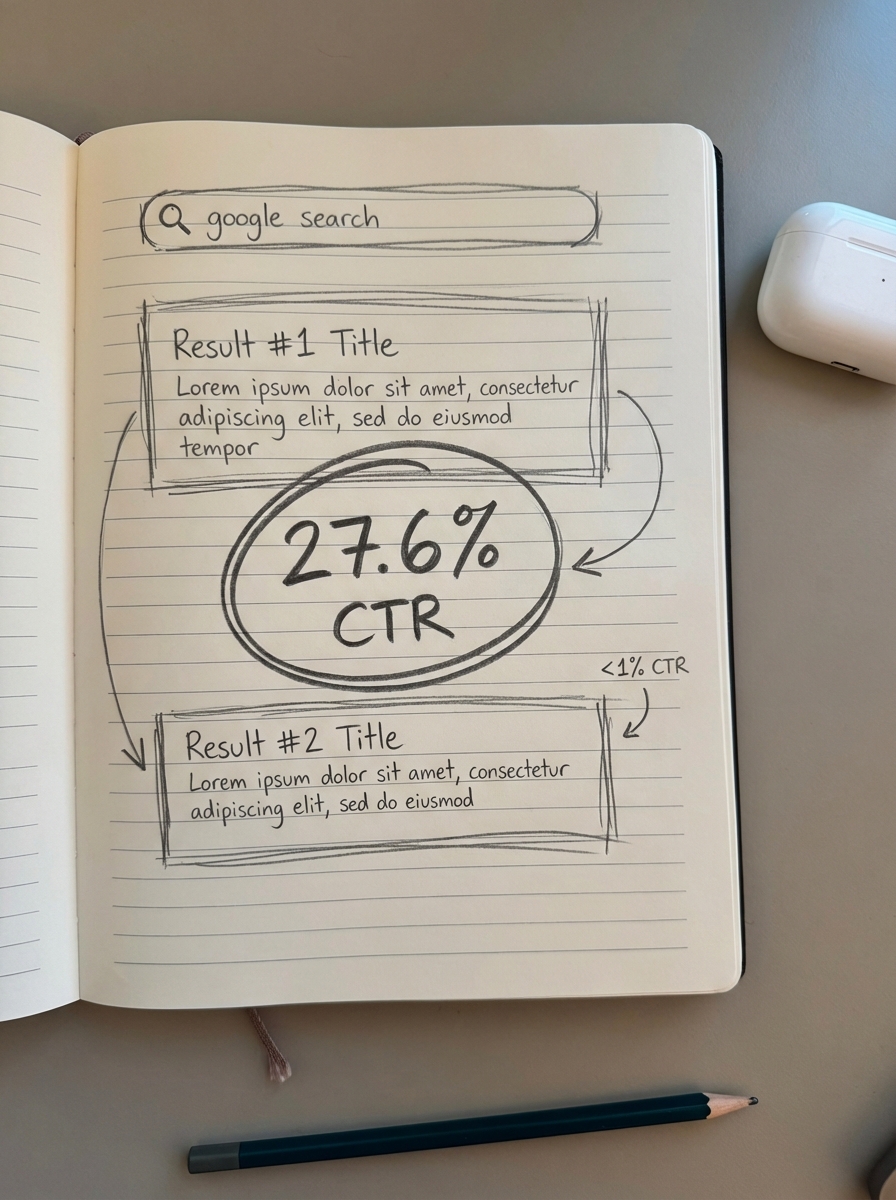
We often see merchants celebrate a “top three” ranking, but the difference between the first and second spot is staggering. Research indicates that position one captures roughly 27.6% of organic clicks, while position two can see a massive drop-off to less than 1% in certain high-competition environments. If your CTR for a top-three position is significantly below the 20–30% range, your snippets are likely failing to pre-qualify buyers. We use an ecommerce SEO dashboard to segment these metrics by page type, as branded queries, category pages, and product pages all have different baseline expectations.
Typical CTR benchmarks provide a clear health check for your SERP presence. Branded queries should generally exceed 10%, while category pages should sit between 5% and 8%. Product pages typically see lower click-through rates, ranging from 3% to 6%. If you notice a low CTR on a high-impression category page, it is a red flag that your title tags aren’t specific enough. This is a common low-hanging fruit opportunity. Most stores use vague names like “Shoes,” when an optimized title generated by a free ecommerce category optimizer would target more specific intent like “Waterproof Trail Running Shoes” to capture higher-intent clicks.
Conversions and revenue per SKU
Traffic is a vanity metric; revenue per session is the diagnostic one that actually matters for your bottom line. A common objection I hear is that SEO traffic doesn’t convert as well as PPC, but this is usually because the merchant is sending traffic to thin product pages rather than robust content that answers buyer questions. By using a catalog-synced blog that responds to real user queries, you can bridge the gap between discovery and purchase.
When analyzing your WooCommerce SEO reporting, look for specific performance signals within your SKU data. A product with high traffic but low conversions likely has a pricing or social proof issue. Since verified reviews can increase conversion rates by up to 40%, adding testimonials is often more effective than further SEO tweaks for these pages. Conversely, low-traffic pages with high conversion rates represent your biggest breakout opportunities. These indicate keywords with high intent where you simply need more supporting content to boost authority. Finally, always track revenue per SKU; if your top-performing products go out of stock, your organic revenue will plummet even if your rankings remain stable.
Diagnosing underperformance with page type segmentation
You cannot accurately diagnose a WooCommerce SEO traffic drop if your data is lumped into a single bucket. Product pages, category pages, and blog posts serve entirely different functions in the funnel. Category pages should be your heavy hitters for broad, high-volume terms. If these are underperforming, it is usually due to a lack of editorial content or “bloat” from duplicate faceted navigation. I believe it is way more important to optimize category pages than product pages, as they capture users earlier in the research phase.
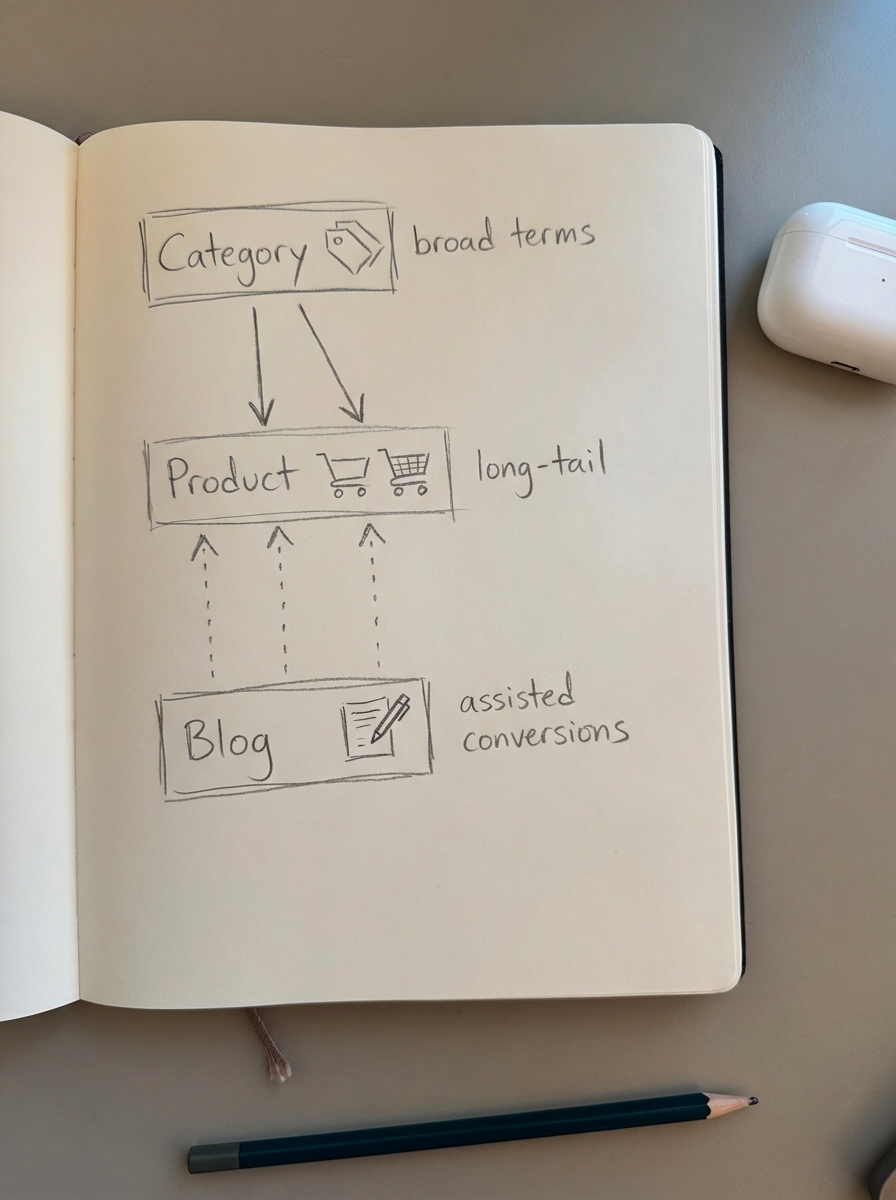
Product pages should target specific long-tail queries. If these rankings are dropping, you should audit your structured data and rich results to ensure Google is displaying price and availability correctly. For most stores, the remaining growth opportunity lies in the blog. If your blog content isn’t driving assisted conversions, you are likely producing “thought leadership” that doesn’t align with your product catalog. High-performing blogs use catalog-aware data to ensure every post points the reader toward a relevant, in-stock SKU.
Setting realistic goals for 2025 and beyond
I strongly recommend that merchants stop using third-party keyword data to set their primary KPIs. These databases are often too small to represent the niche long-tail opportunities that actually drive WooCommerce sales. Instead, use your Google Search Console data as your primary source of truth for what your customers are actually searching for.
You should iterate on your content the same way you iterate on a product. Launch an MVP – perhaps an AI-generated article that covers a specific product category – and if it begins to gain impressions, invest the time to improve it with human expertise and better media. For stores managing over 1,000 products, automating this process is the only way to stay competitive against larger enterprises. Modern SEO is about scale and accuracy, ensuring your content stays updated as your prices, stock levels, and URLs change.
TL;DR
- Benchmark your store against an average 12-month SEO ROI of 3.2x and aim for a 5:1 profit ratio.
- Prioritize position one rankings, as position two can see a massive drop to less than 1% click-share.
- Use segmented reporting to distinguish between category, product, and blog performance.
- Optimize category names specifically to move away from vague terms that kill your CTR.
- Focus on revenue per SKU rather than raw traffic to identify breakout product opportunities.
- Automate content updates and catalog syncing to maintain organic performance without manual overhead.