
Most ecommerce brands chase vanity metrics like keyword rankings while ignoring the data points that actually drive their P&L. If you aren’t measuring organic revenue per session or category-level performance, you aren’t doing SEO; you’re just tracking numbers. To bridge the gap between technical execution and business growth, we need to move beyond raw traffic and look at how search visibility impacts specific segments of your WooCommerce catalog.
The hierarchy of ecommerce SEO metrics
Not all metrics are created equal, and getting bogged down in noise is the fastest way to lose stakeholder buy-in. I categorize performance indicators into three distinct tiers to keep our strategy focused. The top tier is business outcomes, which includes primary revenue, organic conversion rate, and customer lifetime value (LTV) from organic search. These are the metrics that justify your budget and prove that SEO is a profit center rather than a cost.
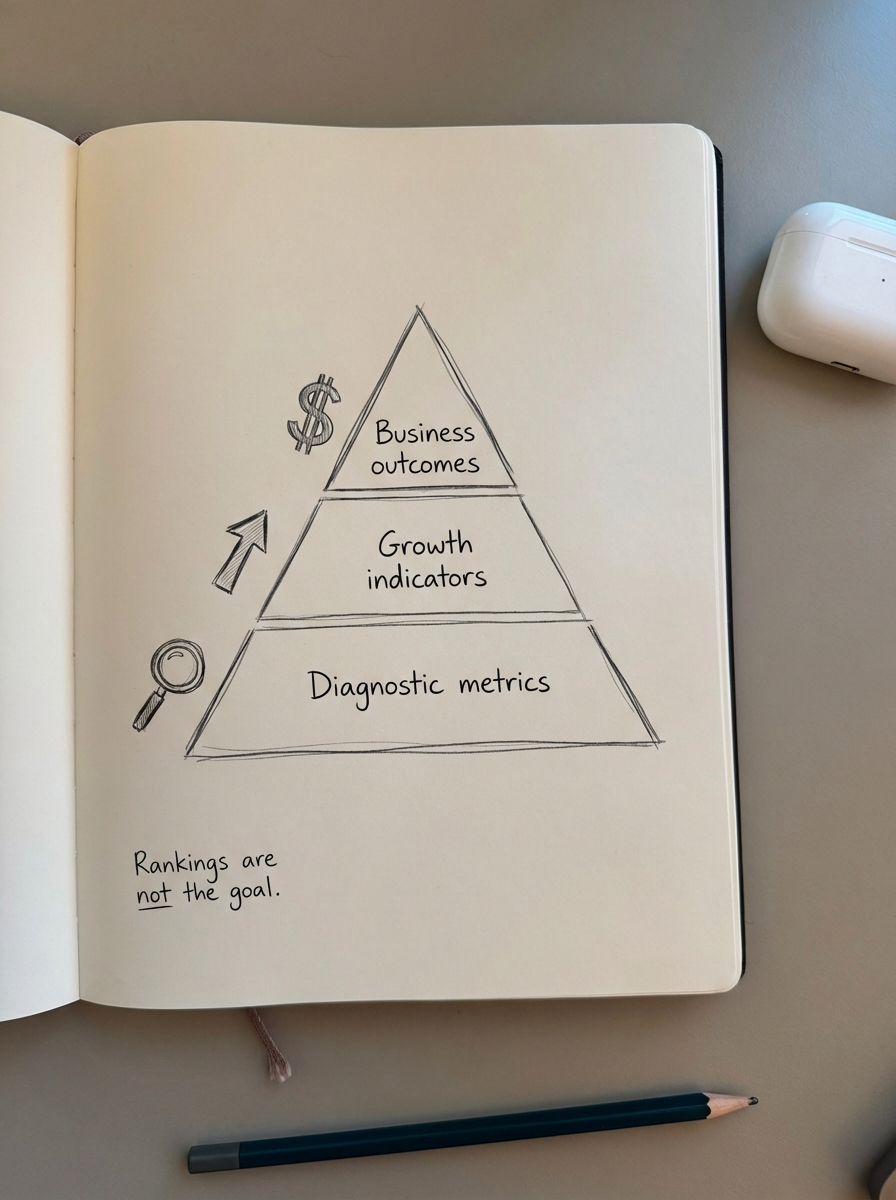
Next are growth indicators, which act as leading signals for future revenue. These include non-branded traffic growth, category page visibility, and assisted conversions generated by your blog content. If your growth indicators are trending upward but your primary business outcomes are flat, your keyword targeting is likely off-base. I often see stores ranking for high-volume terms that have zero commercial intent, leading to a hollow traffic profile that looks great in a chart but does nothing for the bank account.
The final tier consists of diagnostic metrics like keyword rankings, index bloat, and general technical health. While these are necessary for the day-to-day work of an SEO specialist, they should never be the headline of an executive report. They tell us why things are happening, but they aren’t the things themselves.
Revenue and conversion KPIs
These are the metrics your CFO cares about because they translate directly to the bottom line. The single most important metric for understanding the quality of your organic traffic is organic revenue per session (RPS). This figure helps you distinguish between “tourist” traffic – blog readers who are just browsing – and “buyer” traffic.
To calculate Organic RPS, divide your total organic revenue by your total organic sessions. For example, if your WooCommerce store generates $50,000 from organic search across 20,000 sessions, your Organic RPS is $2.50. If you notice an increase in traffic but RPS drops significantly, you are likely attracting users who aren’t ready to buy or your product page SEO is failing to convert them once they land.
Organic conversion rate is another critical benchmark, but you must segment this by landing page type. A category page, a product page, and a blog post all serve different purposes. According to SEO benchmarks across the retail sector, a healthy organic conversion rate usually sits between 1% and 3%, but you will see much higher rates on bottom-funnel product pages compared to informational articles.
Why you must prioritize category-level performance
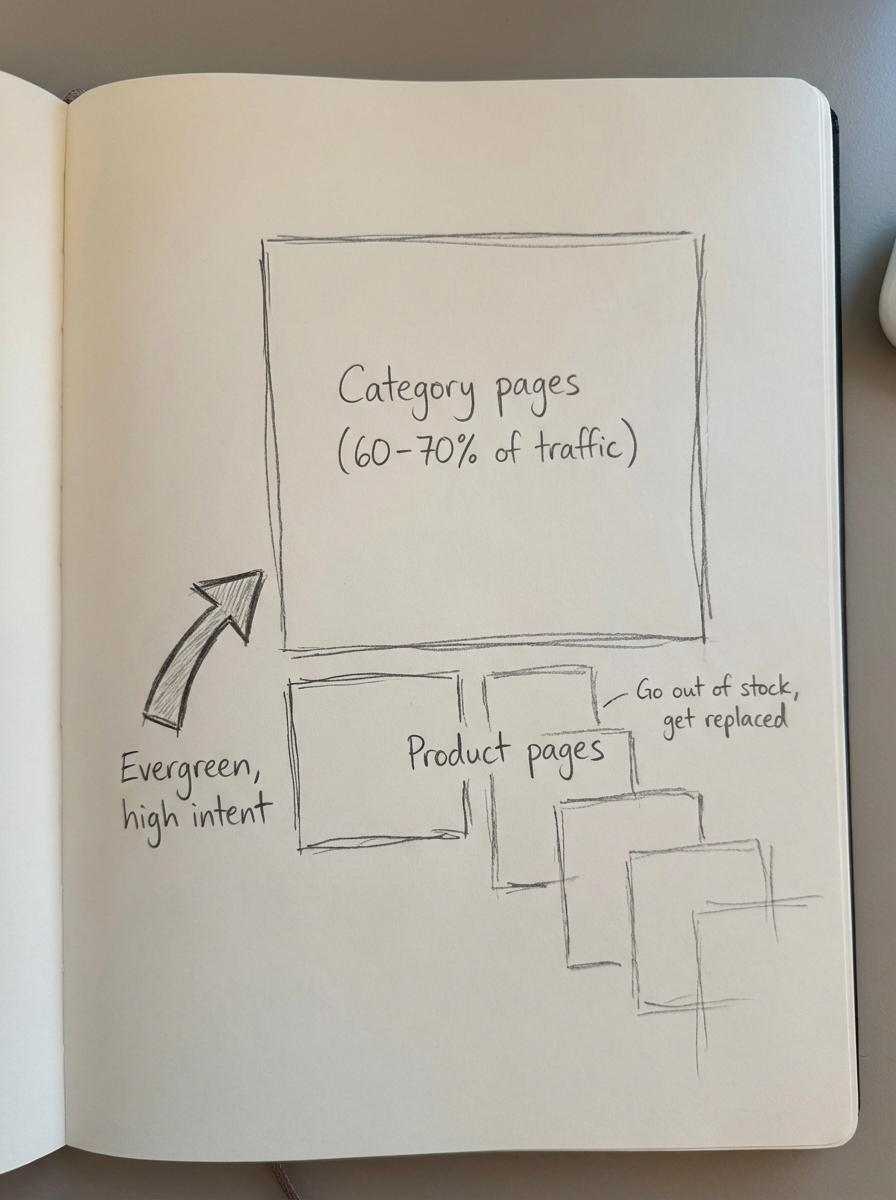
A common contrarian opinion we hold at ContentGecko is that optimizing category pages is significantly more important than optimizing individual product pages. Product pages are transient; they go out of stock, get discontinued, or are replaced by newer models. Categories, however, are evergreen. They capture broader search intent and build authority over time.
Instead of tracking 5,000 individual product keywords, you should track the visibility and share of voice of your top 20 category pages. I find that most stores use vague category names that limit their potential, such as “Accessories” instead of “Leather Camera Accessories.” You can use our Free Ecommerce Category Page Optimizer to identify if your naming conventions are holding back your rankings.
If your category pages aren’t driving at least 60% to 70% of your transactional organic traffic, you likely have a site architecture problem. This often manifests as index bloat where thousands of duplicate or low-value pages are generated by faceted navigation filters, diluting your topical authority and confusing search engines.
Measuring content and blog ROI
For a WooCommerce store, the blog shouldn’t just be a place for thought leadership; it should function as a conversion engine. We focus on how-to guides, buyer guides, and listicles that link directly back to your product catalog. Informational content rarely converts on the first click, so you need to track assisted conversions in GA4 to see the full picture.
By looking at attribution paths, you can see how many people read a blog post and then returned to purchase a product a few days later. When you use a WordPress connector plugin, you can sync your product catalog directly to your blog content. This ensures your articles always feature in-stock, relevant products, which significantly increases the likelihood of these assisted sales.
We have also found that SEO publishing frequency has a compounding effect on your overall topical authority. A helpful metric to track here is the number of new ranking keywords per 10 articles published. If you divide the number of new keywords in the top 100 by the total articles published in a specific period, you can measure the efficiency of your content production.
Technical and efficiency metrics
Technical SEO in a WooCommerce environment is often about subtraction rather than addition. The most common mistake is a bloated website with thousands of duplicate pages. Beyond cleaning up the mess, you should focus on how search engines present your products. With the rise of AI-driven search, standard blue links are losing ground to rich results.
You need to track the click-through rate (CTR) of your product-rich results specifically. Merchants using AI-generated product schema see an average 23% higher CTR for product-rich results compared to those without. You can monitor this in the Search Appearance tab of Google Search Console.
In our Ecommerce SEO Dashboard, we also track a metric called potential additional clicks. This estimates the traffic you are leaving on the table for keywords where you already rank on page one but haven’t hit the top spot. To calculate this, take the total impressions for keywords ranked 2 through 10, multiply them by the industry standard CTR for position 1, and subtract your current clicks. This gives you a clear target for optimization efforts.
How to structure your SEO reporting
I recommend a tiered reporting cadence to avoid data fatigue and ensure that everyone from the developer to the CEO is looking at the right information.
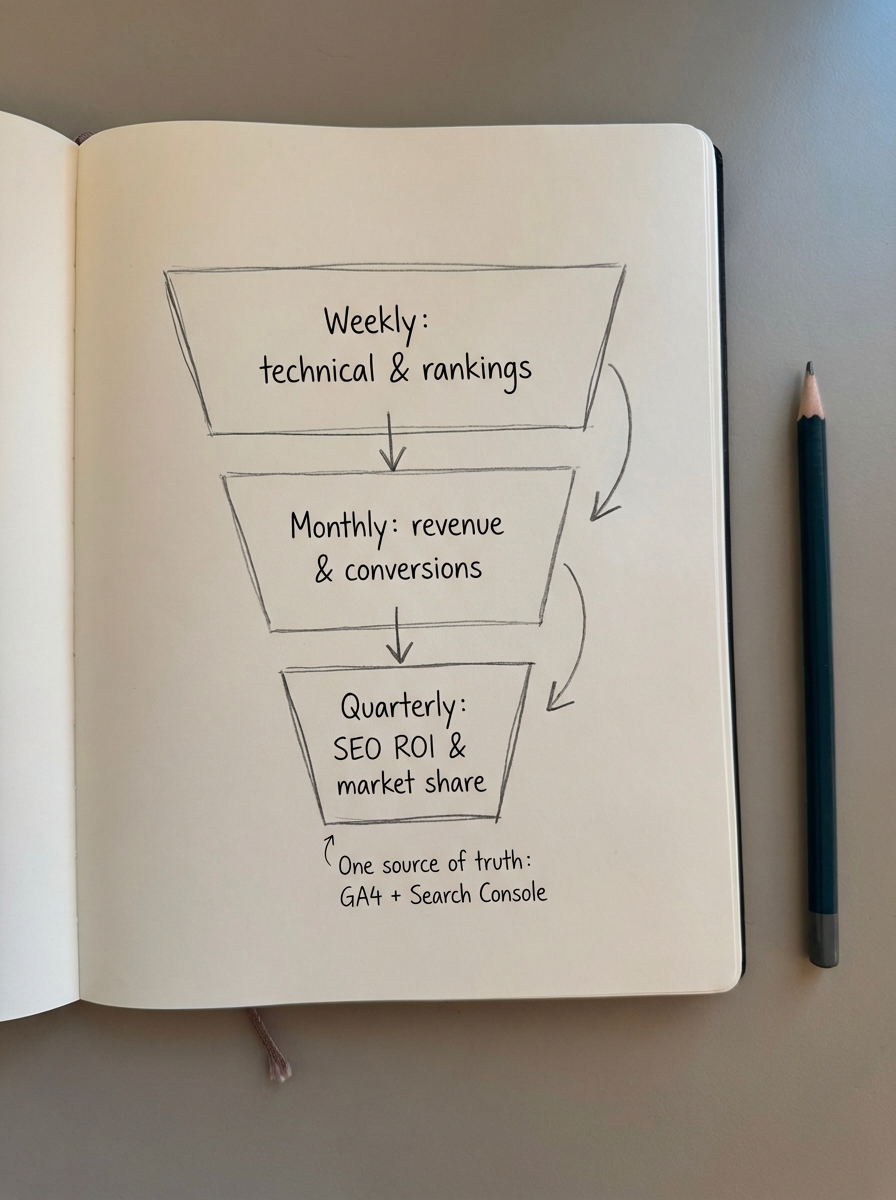
- Weekly reports should be automated and focus on technical health, crawl errors, and rank tracking tools for your core categories.
- Monthly reports should be more strategic, covering organic revenue, conversion rates by page type, and the results of regular SEO content audits.
- Quarterly reports are for executives and should focus on high-level SEO ROI, market share growth against competitors, and visibility in emerging LLM search results.
To make this manageable, you must combine Google Analytics and Search Console data into a single source of truth. This allows you to see the full journey from a specific search query to a “thank you” page on your store. If you are struggling to visualize this, a professional SEO report example can provide a blueprint for connecting technical metrics to the business outcomes that stakeholders actually care about.
TL;DR
Focus your energy on organic revenue per session and category-level visibility rather than chasing generic keyword rankings. Prioritize category page optimization over transient product pages to build long-term authority and prevent index bloat. Use assisted conversion tracking to justify your blog spend, and automate the grunt work of publishing and schema updates so you can focus on interpreting the data. If you aren’t sure where to start, auditing your GA4 and Search Console setup for WooCommerce is the first step toward accurate and actionable reporting.